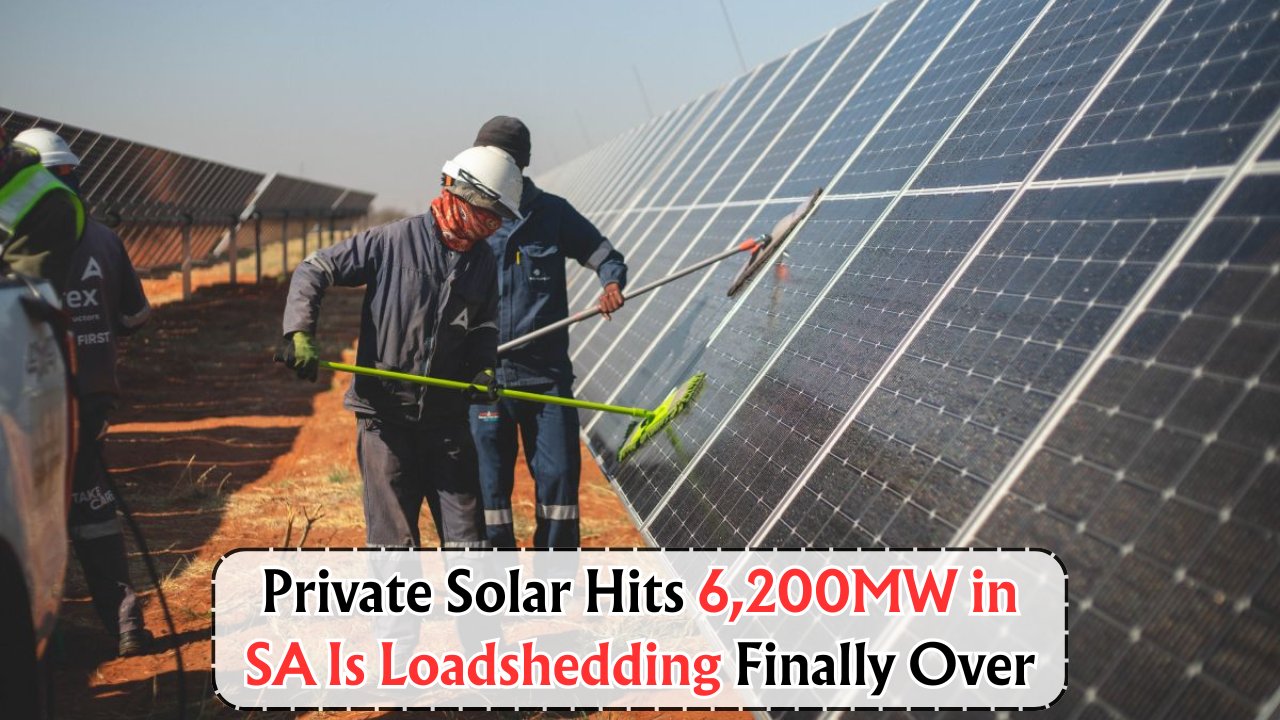
SA Private Solar – In a landmark energy shift, South Africa has officially crossed the 6,200MW mark in private solar generation by August 2025. This rapid surge, largely driven by households, commercial entities, and independent producers, could mark the beginning of the end for the country’s infamous loadshedding. For decades, Eskom’s strained infrastructure left millions in the dark—literally and figuratively. But now, with a decentralised solar energy boom reshaping the grid, citizens are beginning to ask: Is loadshedding truly over? Over the past 24 months, the government eased licensing restrictions, introduced tax incentives, and allowed large-scale wheeling of privately generated power back into the grid. The result has been transformative: businesses now operate with less interruption, households enjoy greater energy reliability, and rural areas are getting electrified through solar microgrids. But the real question remains: can private generation consistently meet demand and prevent future Stage 4 to Stage 6 emergencies? In this article, we break down the milestones, stats, policies, and future plans shaping South Africa’s solar-powered transformation.
SA Private Solar Boom: Key Stats and Timeline
Since 2023, the growth of rooftop and commercial solar has been exponential. Here’s how the trend has evolved over time:
Key Milestones and Figures
- 2023: Private solar generation at just under 1,200MW
- Mid-2024: Fast-tracked Eskom feed-in approvals enabled broader expansion
- Dec 2024: Reached 4,800MW in combined residential and commercial solar
- Aug 2025: Surpassed 6,200MW in private solar capacity
Solar Generation Growth (2023–2025)
| Month & Year | Private Solar Capacity (MW) | % Increase | Major Drivers |
|---|---|---|---|
| Jan 2023 | 1,150 | – | Limited adoption, early policies |
| July 2023 | 2,200 | +91% | Commercial installation incentives |
| Jan 2024 | 3,700 | +68% | Relaxed licensing & feed-in tariffs |
| July 2024 | 4,800 | +29% | Wheeling approved via Eskom |
| Jan 2025 | 5,800 | +20.8% | Rural microgrids, tax write-offs |
| August 2025 | 6,200 | +6.8% | Full integration with municipal grids |
What’s Driving This SA Private Solar Surge?
South Africans, tired of constant blackouts, began investing in energy independence. Key reforms from the government and proactive policies also played a role.
Main Growth Factors
- Tax Rebates of up to 125% for solar hardware and installation
- Municipal Feed-In Tariffs for households generating excess energy
- Relaxation of Licensing requirements for under-100MW plants
- Eskom Grid Access for private producers to sell surplus power
- National Treasury’s Energy Bounce Scheme for SMEs
Top Provinces Leading the Solar Race
Some provinces are miles ahead due to aggressive municipal participation and corporate adoption.
- Western Cape – Cape Town’s reverse-feed programme surged participation
- Gauteng – Industrial parks embraced rooftop solar aggressively
- KwaZulu-Natal – Agricultural solar pumps and farms went solar-first
- Eastern Cape – New green zones attracted manufacturing plants
Provincial Breakdown of Private Solar (Aug 2025)
| Province | Total Capacity (MW) | Top Contributors |
|---|---|---|
| Western Cape | 1,700 | Cape Town households + businesses |
| Gauteng | 1,450 | Industrial parks and malls |
| KwaZulu-Natal | 980 | Solar irrigation and agro-facilities |
| Eastern Cape | 700 | Renewable manufacturing hubs |
| Limpopo | 600 | Private mines + off-grid communities |
| Northern Cape | 480 | Hybrid farms and microgrids |
| Others | 290 | Homeowners in rural municipalities |
Is Loadshedding Over? A Cautious Optimism
Many energy experts agree that loadshedding is no longer as severe—but it’s premature to say it’s over for good.
Key Improvements Observed
- Stage 4–6 outages have not occurred since March 2025
- Cape Town, eThekwini, and Tshwane now operate 80–90% on stable power
- Emergency diesel expenditure dropped by 72% since last year
- Businesses report 40% fewer production losses
But What Are the Remaining Risks?
Despite optimism, there are still bottlenecks and vulnerabilities in the national grid.
- Grid Infrastructure – Cannot yet handle high reverse-feed volumes
- Storage Limitations – Battery backup deployment is still under 20%
- Policy Delays – Uncertain timelines for national grid upgrades
- Affordability – High upfront solar costs still lock out low-income homes
Major Policy Reforms Fueling the Growth
In addition to public frustration with Eskom, several legislative moves accelerated the solar shift.
- The 2024 Electricity Regulation Amendment Bill gave IPPs grid access
- DTIC Incentive Packages supported industrial solar farms
- Green Energy Tax Act 2025 pushed household adoption
- NERSA’s Dynamic Tariff Framework enabled easier solar unit selling
These combined factors have significantly altered South Africa’s energy landscape within just two years.
How Households and Small Businesses Are Benefiting
From cost savings to better energy reliability, everyday citizens are seeing real change.
- A home with a 6kW solar system in Gauteng saves R1,800/month in electricity
- SMEs in Cape Town avoid 60+ hours of downtime monthly
- Security systems now operate 24/7 without loadshedding disruption
- Communities with co-operative solar see consistent water supply
Departmental Contacts for Energy and Solar Queries
For those looking to install solar, get approvals, or seek grants, these are the main contact points:
Department of Mineral Resources and Energy (DMRE)
- Website: www.energy.gov.za
- Phone: 012 406 8000
- Email: [email protected]
National Energy Regulator of South Africa (NERSA)
- Website: www.nersa.org.za
- Phone: 012 401 4600
- Email: [email protected]
Department of Trade, Industry, and Competition (DTIC)
- Website: www.thedtic.gov.za
- Phone: 0861 843 384
- Email: [email protected]
Eskom Solar Feed-In Helpdesk
- Website: www.eskom.co.za
- Phone: 0860 037 566
- Email: [email protected]
National Treasury – Energy Bounce Back Support
- Website: www.treasury.gov.za
- Phone: 012 315 5111
- Email: [email protected]
Municipal Renewable Energy Units
- Contact your local municipality’s electricity department
- Municipalities in Cape Town, Tshwane, eThekwini have dedicated solar desks
Benefits of Private Solar vs Eskom Dependency
| Metric | Private Solar | Eskom Reliance |
|---|---|---|
| Average Monthly Savings | R1,200–R2,000 | – |
| Downtime Per Month | Under 2 hours | 20–60 hours |
| Installation Timeline | 2–4 weeks | N/A |
| Long-Term Cost Recovery | 3–5 years | – |
| Feed-In Option | Yes (most cities) | No |
| Govt Support Available | Yes – rebates & grants | Limited |
| Energy Independence Level | High | None |
The 6,200MW milestone is undoubtedly a breakthrough. Yet, long-term success hinges on supportive policy, reliable storage, and equitable access. For now, many South Africans are breathing a sigh of relief—but the road to a fully stable, fair, and renewable energy future still requires vigilance and sustained investment.
FAQs – South Africa’s 6,200MW Private Solar Milestone
1. Is loadshedding officially over in South Africa now?
No, but the frequency and severity of loadshedding have significantly reduced in most areas due to increased private solar generation.
2. Who can install private solar systems and feed power into the grid?
Both households and businesses can install solar systems and, in most municipalities, feed excess power back into the grid under approved programmes.
3. Are there government incentives for installing solar in 2025?
Yes, the government offers tax rebates, zero-VAT import on panels, and SME loan guarantees under the Energy Bounce Back Scheme.
4. Which provinces lead in private solar generation?
Western Cape, Gauteng, and KwaZulu-Natal are currently leading in total installed private solar capacity.
5. Can solar power completely replace Eskom electricity for a home?
Yes, with a properly sized system and battery backup, a home can become nearly or fully independent from Eskom.